Business Intelligence
Power BI, DAX, Power Query, KPI design, interactive dashboards and executive reporting.
Data Analyst | Software Engineer | Business Intelligence Analyst
I’m Ernest-Cyril Divine Onyeze. I analyse data, build dashboards and develop web applications that turn information into practical tools and clear business decisions.

I combine Data Analytics, Business Intelligence and Software Engineering. I use Power BI, SQL, Excel and Python to build reliable models and intuitive dashboards, and Django, SQL and Bootstrap to develop database-backed web applications.
My approach combines analytical rigour with clear visual communication. I care about data quality, meaningful metrics and making every report easy to explore—not just impressive to look at.
View my full CV ↗Power BI, DAX, Power Query, KPI design, interactive dashboards and executive reporting.
Excel, SQL, Python, exploratory analysis, data cleaning and insight development.
Star schemas, relationships, date dimensions, calculated measures and model optimisation.
Data storytelling, stakeholder-focused design, documentation and actionable recommendations.
Python, Django, SQL and Bootstrap: database-backed web applications, backend logic and responsive interfaces.
Microsoft Certified
Earned September 2026 · Valid through September 2027
Featured Power BI case study
An end-to-end BI project that transforms 51,290 order-line records into a four-page decision-support dashboard.
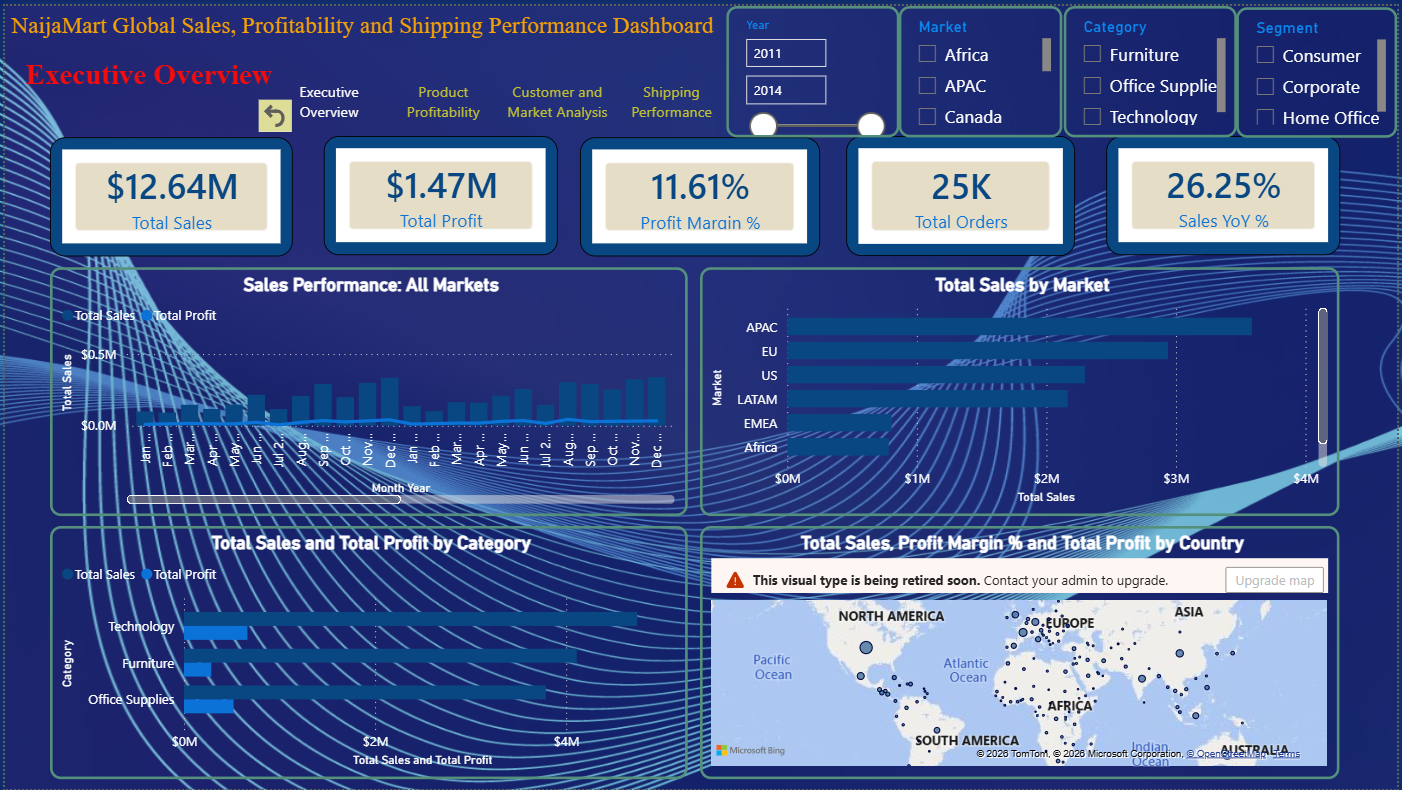
NaijaMart needed a clear view of sales growth, product profitability, customer and market performance, and shipping efficiency. The source data required cleaning, date correction and dimensional modelling before it could support reliable analysis.
My approachFeatured SQL case study
An end-to-end MySQL investigation of customer churn, historical customer value and practical retention priorities across 7,043 telecom customers.
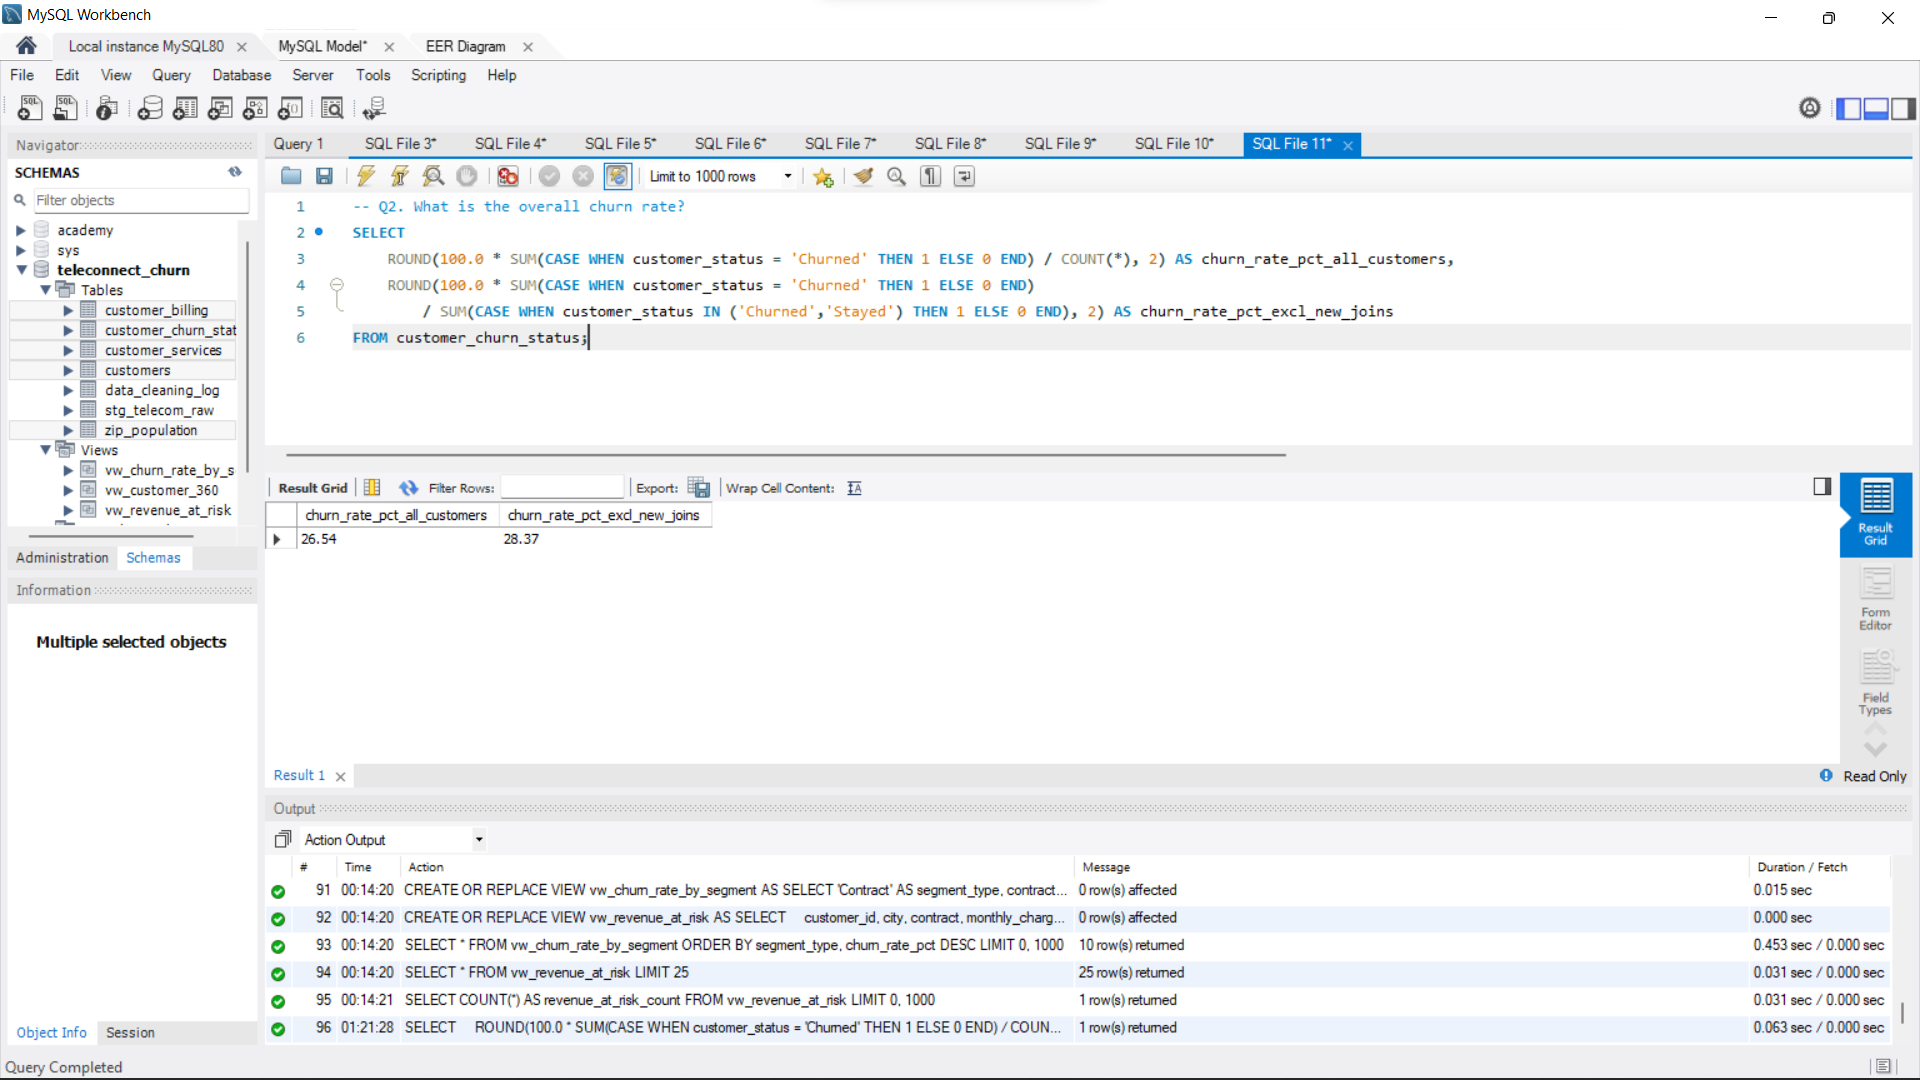
I designed and queried a relational MySQL database to identify the customer segments most associated with churn, quantify historical value linked to churned customers and create a rule-based priority list for proactive retention.
MySQL and SQL skillsFeatured Excel case study
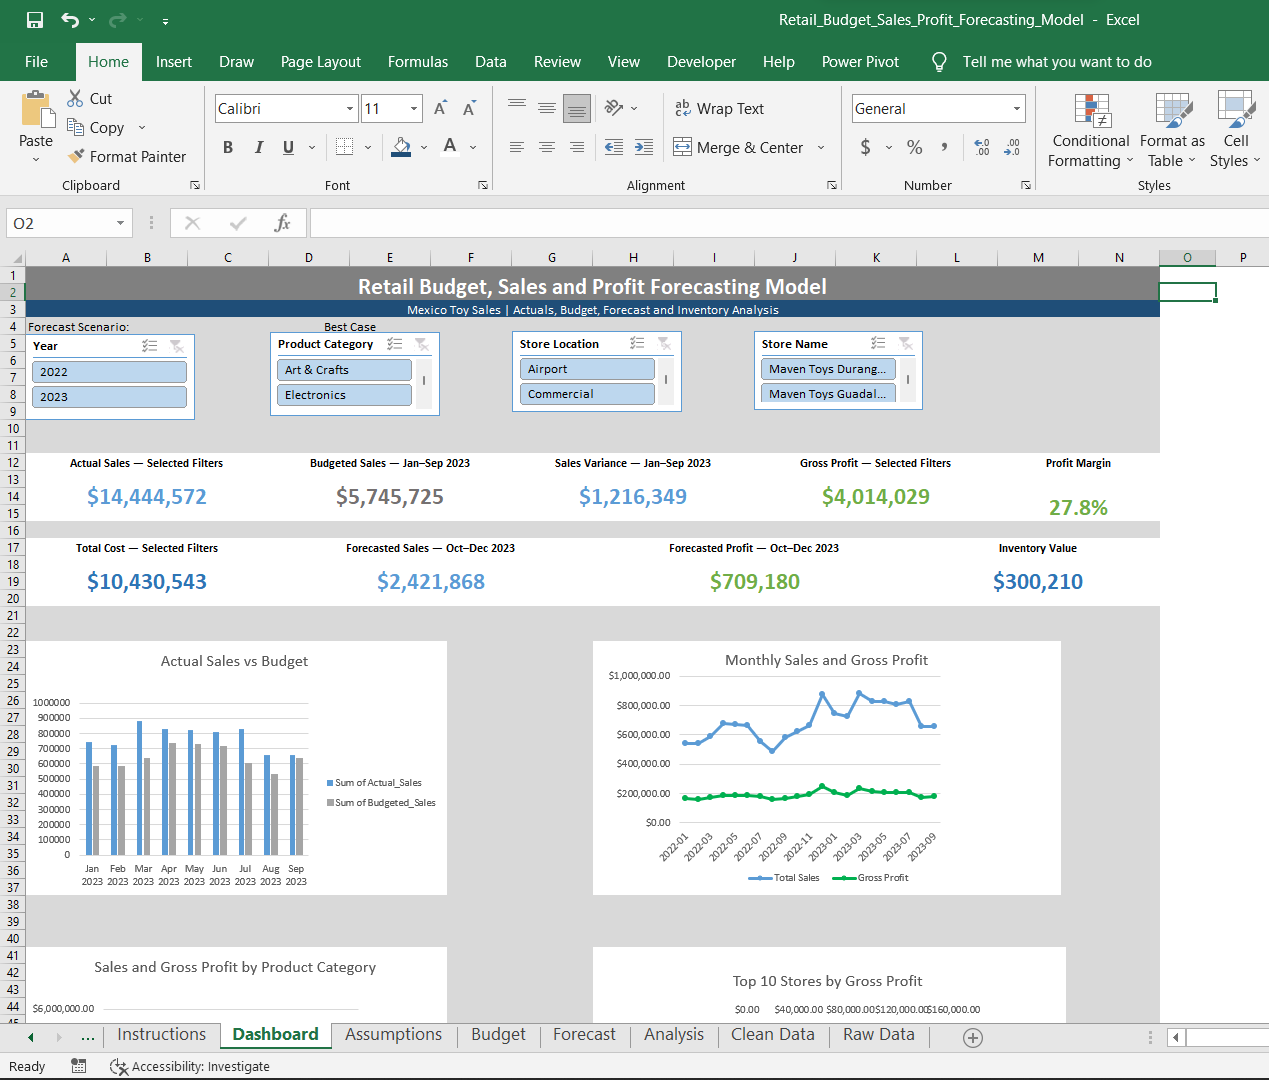
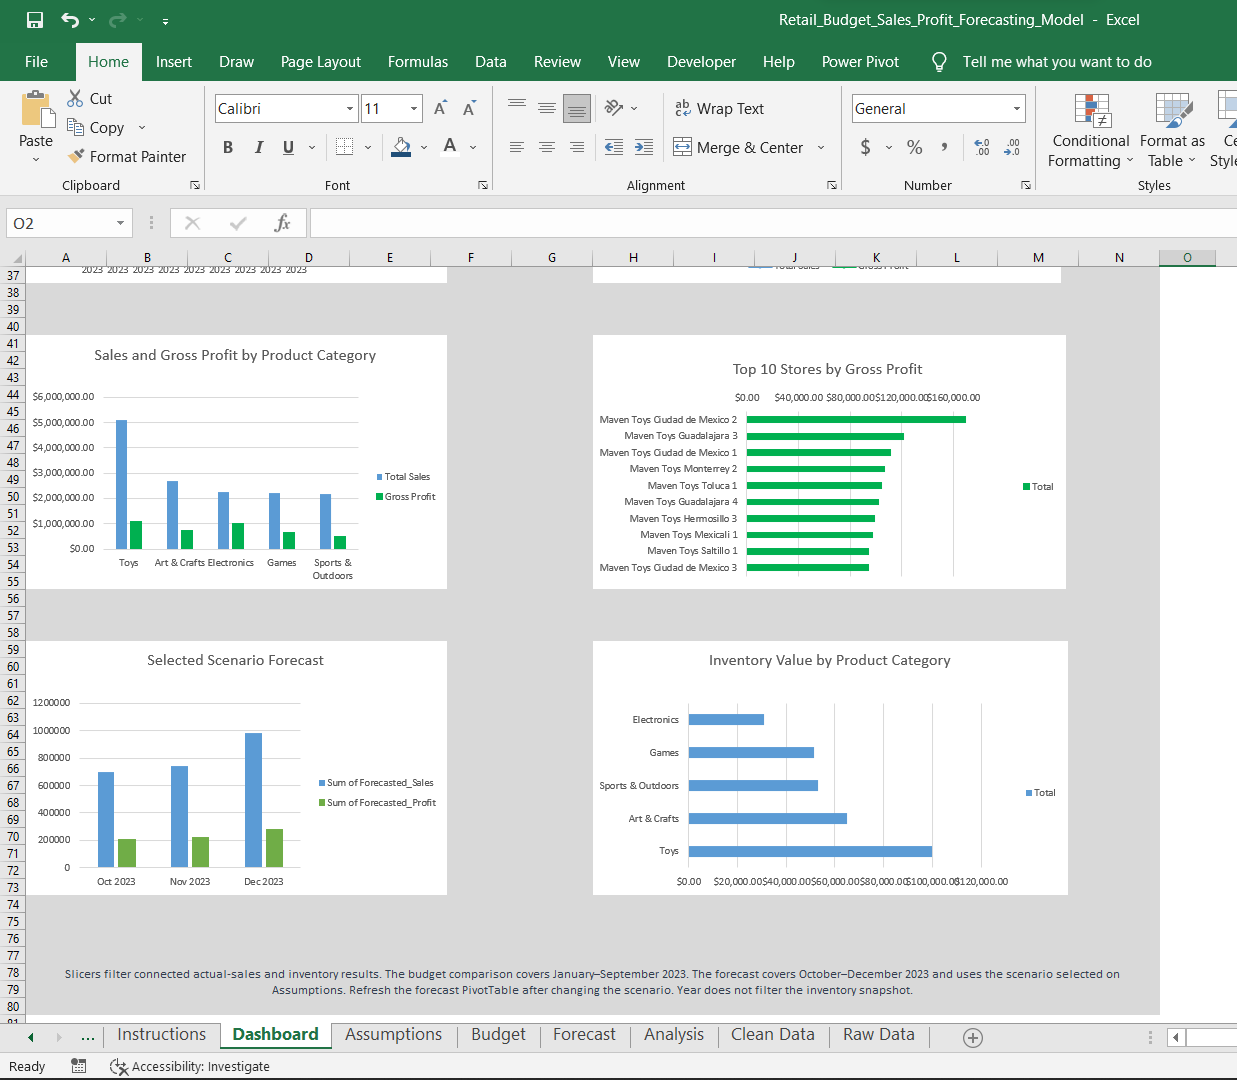
An Excel 2019 model combining 829,262 retail transaction lines with budget comparisons, gross profitability, inventory valuation and three forecast scenarios.
I used Maven Analytics Mexico Toy Sales data to analyse a fictional toy-store chain across 35 products and 50 stores. The workbook connects historical performance with transparent budget targets and adjustable sales-growth and cost assumptions.
Excel skills demonstratedThe Jan–Sep 2023 budget uses comparable 2022 sales with editable category growth targets. The Oct–Dec 2023 forecast uses the corresponding 2022 seasonal baselines under Best, Expected and Worst Case assumptions. These are modelled targets and estimates. Profit refers to gross profit before operating expenses.
The workbook is saved in Best Case. Select a scenario on Assumptions, then refresh the forecast PivotTable at Analysis!X55 to update its chart. Historical slicers and the fixed budget and forecast periods are explained in the documentation.
Software engineering project
A Django web application that simulates infrastructure health monitoring and turns threshold breaches into actionable incidents.
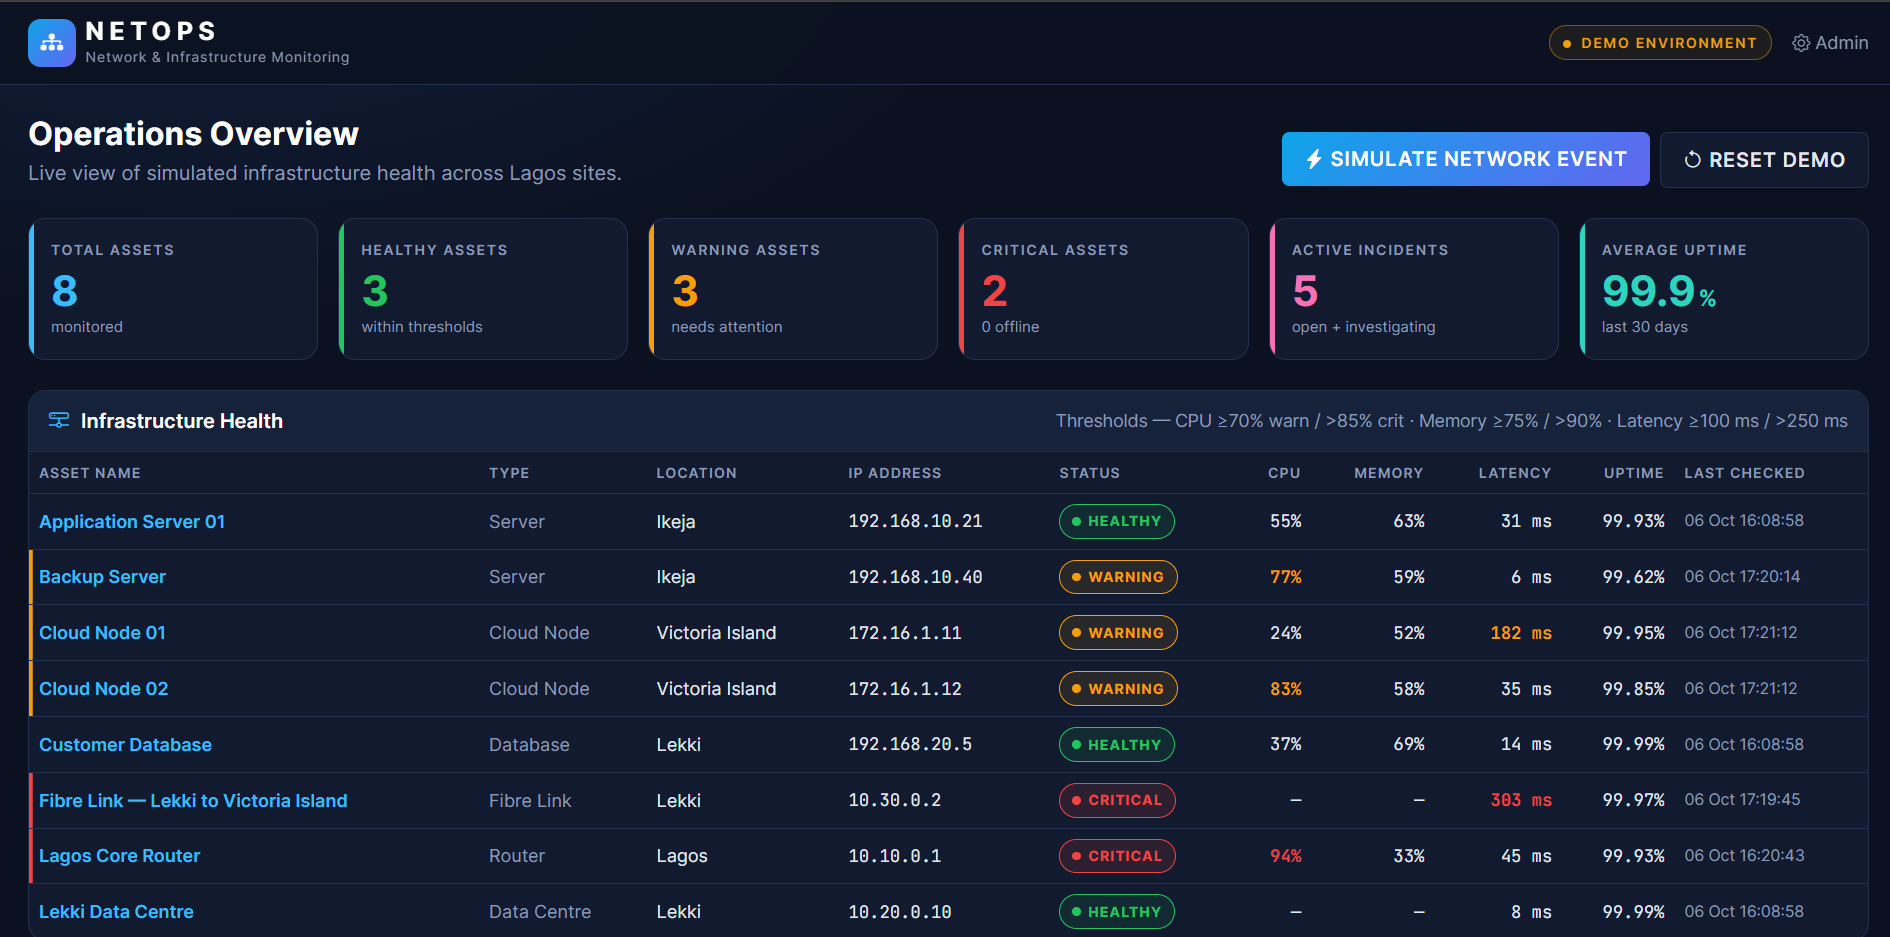
Operations teams need to identify which servers, routers, fibre links, cloud nodes and databases require attention. I built NetOps as an independent portfolio prototype to demonstrate a central monitoring view and a database-backed incident workflow.
ImplementationAll infrastructure and metrics are fictional and simulated. This prototype does not scan or connect to real networks. Recommendations use predefined rules rather than AI-generated advice.
Define the business questions and identify the decisions the analysis must support.
Profile, clean and validate the data before designing a dependable model.
Create meaningful measures and investigate the patterns behind performance.
Deliver a clear, interactive story with findings people can act on.
Available for opportunities
I’m open to opportunities in Data Analytics, Business Intelligence and Software Engineering, including roles and collaborations involving dashboards, data workflows and web applications.