Business Intelligence
Power BI, DAX, Power Query, KPI design, interactive dashboards and executive reporting.
Data Analyst · Business Intelligence Analyst
I’m Ernest-Cyril Divine Onyeze. I clean, model and visualise data to uncover the patterns leaders need to act with confidence.

I am a Data Analyst and Business Intelligence Analyst with a background in Software Engineering. I use Power BI, SQL, Excel and Python to transform raw information into reliable models, intuitive dashboards and practical recommendations.
My approach combines analytical rigour with clear visual communication. I care about data quality, meaningful metrics and making every report easy to explore—not just impressive to look at.
View my full CV ↗Power BI, DAX, Power Query, KPI design, interactive dashboards and executive reporting.
Excel, SQL, Python, exploratory analysis, data cleaning and insight development.
Star schemas, relationships, date dimensions, calculated measures and model optimisation.
Data storytelling, stakeholder-focused design, documentation and actionable recommendations.
Microsoft Certified
Earned September 2026 · Valid through September 2027
Featured Power BI case study
An end-to-end BI project that transforms 51,290 order-line records into a four-page decision-support dashboard.
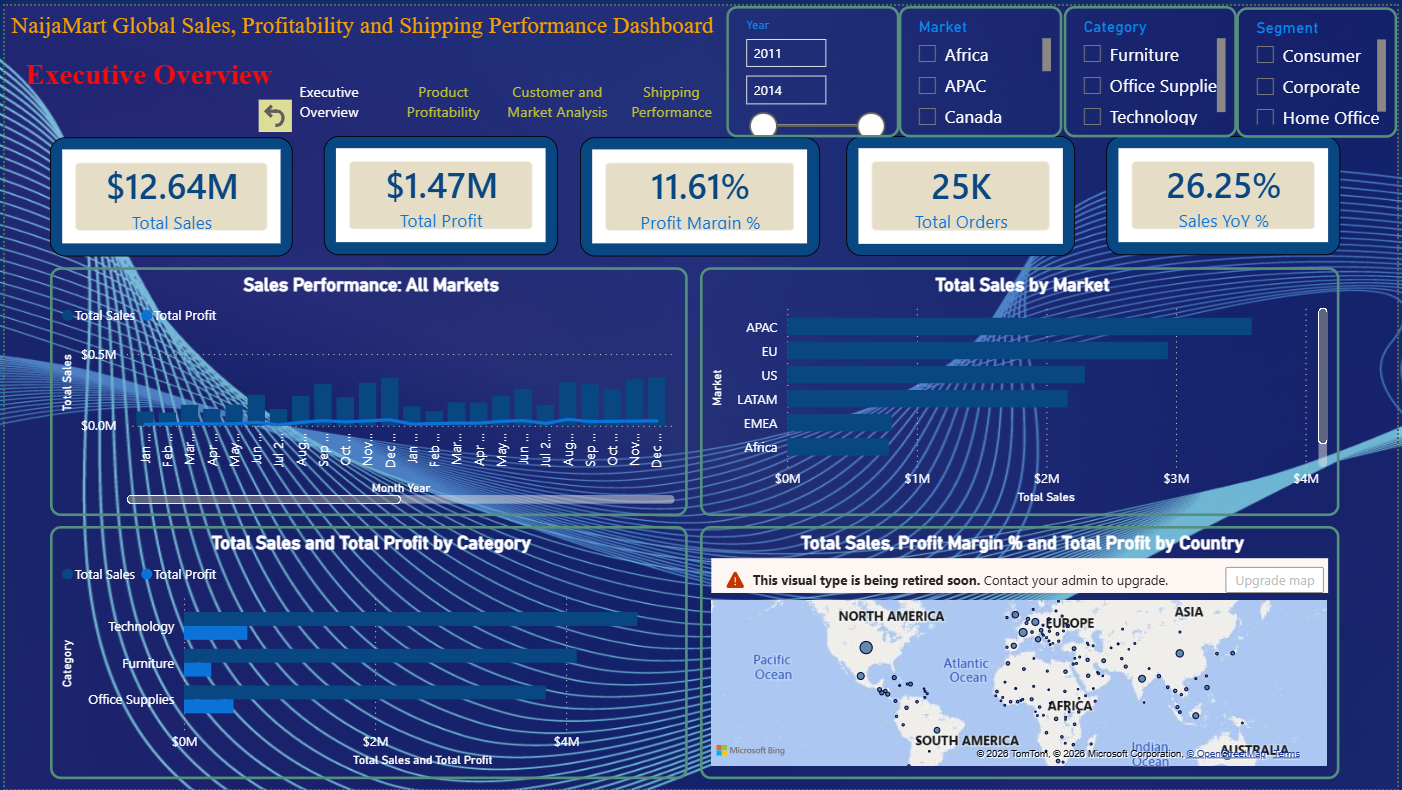
NaijaMart needed a clear view of sales growth, product profitability, customer and market performance, and shipping efficiency. The source data required cleaning, date correction and dimensional modelling before it could support reliable analysis.
My approachFeatured SQL case study
An end-to-end MySQL investigation of customer churn, historical customer value and practical retention priorities across 7,043 telecom customers.
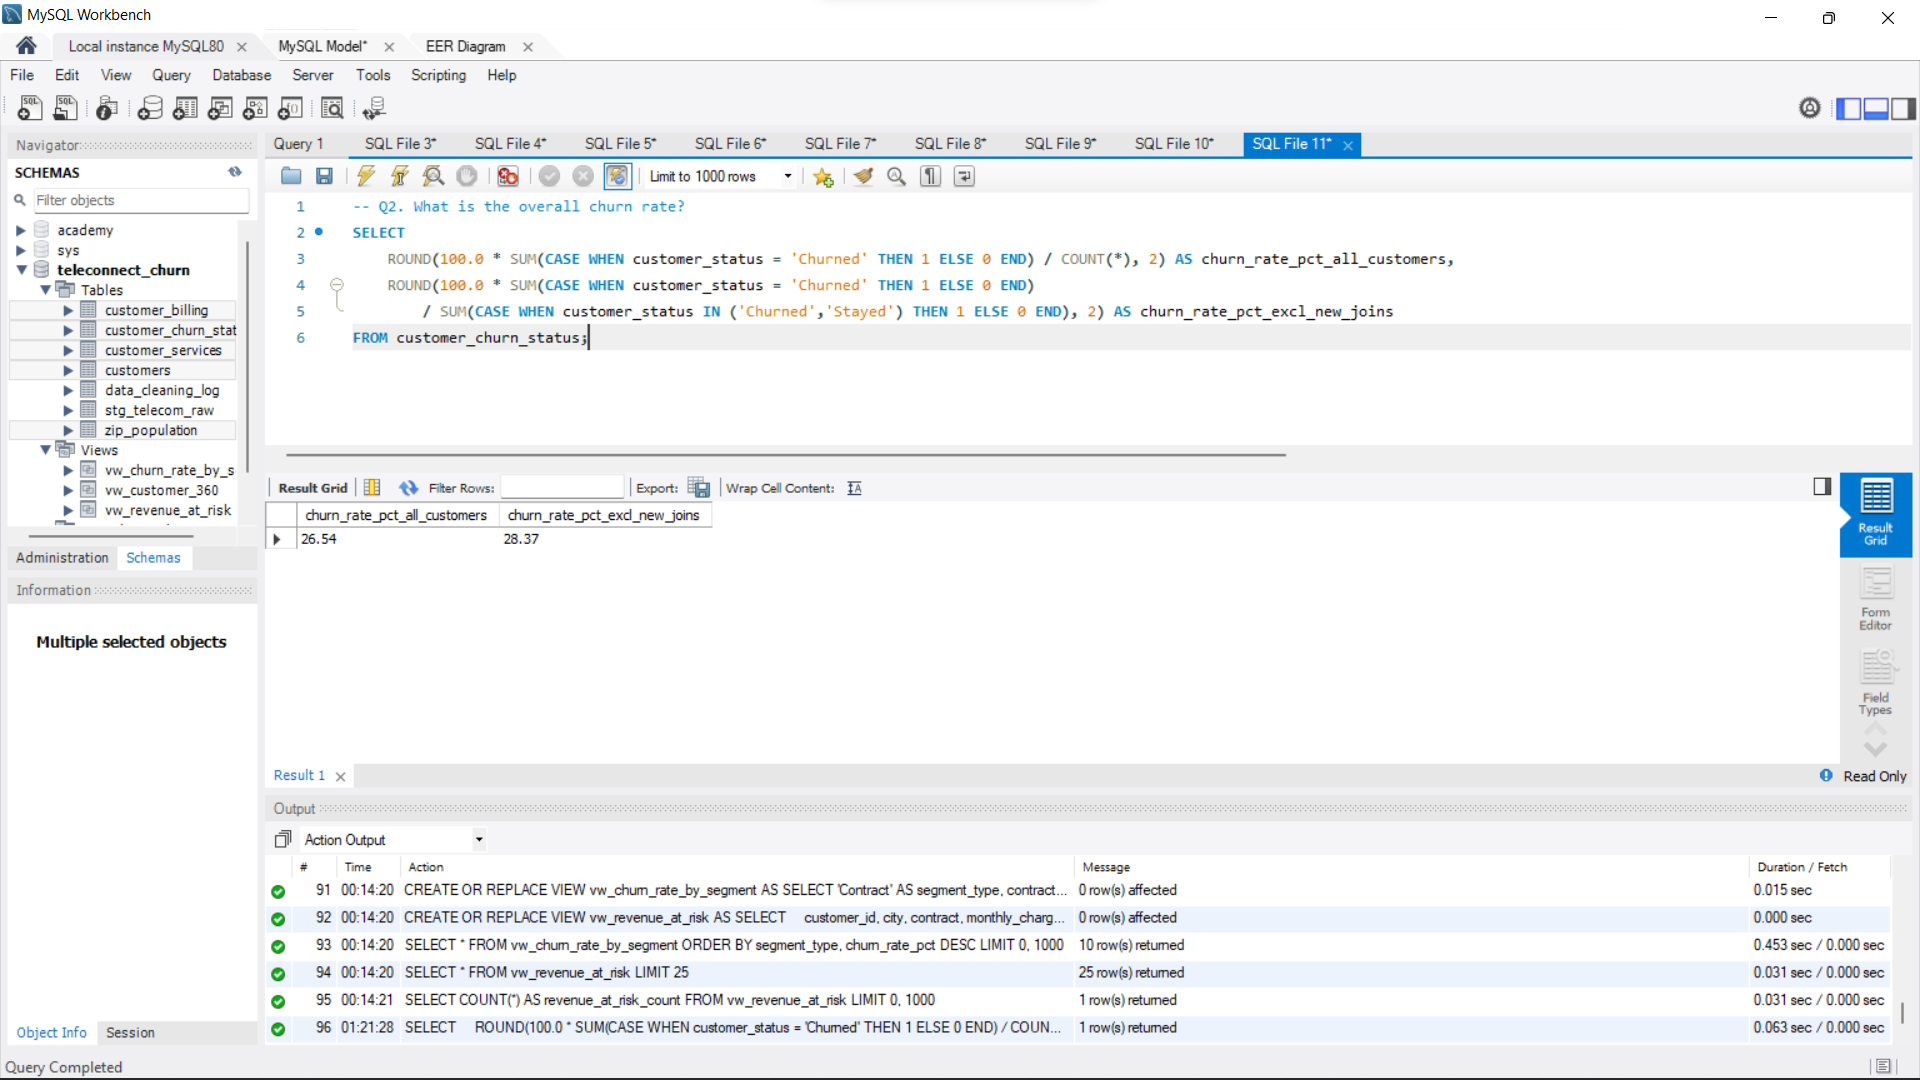
I designed and queried a relational MySQL database to identify the customer segments most associated with churn, quantify historical value linked to churned customers and create a rule-based priority list for proactive retention.
MySQL and SQL skillsExcel · Financial modelling
Define the business questions and identify the decisions the analysis must support.
Profile, clean and validate the data before designing a dependable model.
Create meaningful measures and investigate the patterns behind performance.
Deliver a clear, interactive story with findings people can act on.
Available for opportunities
I’m open to Data Analyst and Business Intelligence Analyst roles, collaborations and thoughtful conversations about data.